
Ethereum price has dropped nearly 5% to trade around $1,682, but the more significant story isn’t the decline itself — it’s the unusual quiet building beneath the surface. Options open interest, perpetual funding rates, and spot ETF flows have all drained toward multi-month lows simultaneously, a combination that historically precedes sharp directional moves rather than continued calm.

Ethereum price prediction framework at CryptaBlocks treats this kind of volatility compression as a signal worth watching closely. When positioning washes out across derivatives and spot markets at the same time, the next clear catalyst tends to move price quickly, with little resistance in either direction.
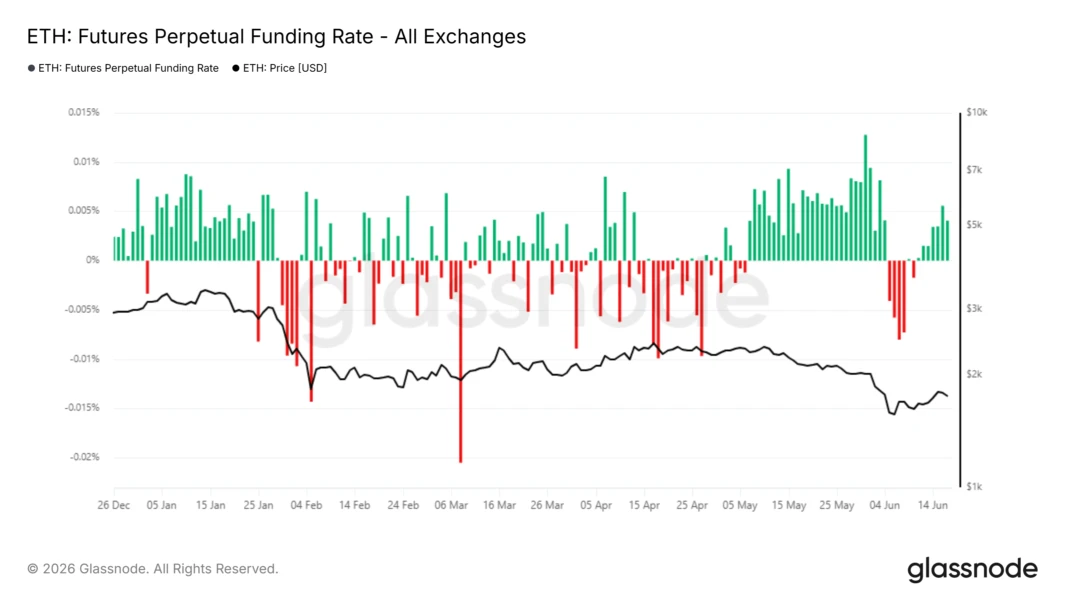
Derivatives Positioning Has Drained to Multi-Month Lows
Ethereum options open interest across exchanges has fallen to roughly $5.5 billion, well below the $8.5 billion peaks recorded earlier this year in January and March. Traders have been closing out futures positions rather than adding fresh exposure, a clear sign of de-risking rather than conviction in either direction.
Perpetual funding rates reinforce this picture. After a brief negative spike around the early-June low, funding has flattened close to zero. Neither long nor short positioning currently holds a crowded edge, which means leverage is no longer fueling price action the way it was during the May breakdown.
“Low open interest and neutral funding mean less leverage feeding the price. A clear catalyst could therefore move ETH quickly with little resistance.”
For investors, this washed-out positioning is a structural signal, not noise. It suggests the market has largely flushed out overleveraged participants, setting the stage for a cleaner, less crowded move once a genuine catalyst appears.
ETF Flows Are Quietly Shifting
The bearish read on Ethereum has one notable complication: spot Ethereum ETF net flows have stopped bleeding after months of steady outflows. June has produced several small green inflow days, breaking a persistent pattern of institutional selling.
The inflow amounts remain modest and well under the $250 million spikes seen in January, so this shift shouldn’t be overstated. But the change from sustained selling to mild buying is meaningful in its own right — it suggests institutional demand may no longer be pointed firmly in one direction.

Our analysts view a sustained return of positive ETF flows as the strongest evidence that the recent low near $1,500 could mark a durable floor rather than a temporary pause before further downside.
Ethereum Price Prediction: The $1,500 and $1,920 Levels That Matter
Ethereum’s recent technical structure has been defined by two major support breaks. Price lost an ascending trendline and the $2,150 level on May 17, then broke down further through a descending channel and support near $1,920.
That decline found buyers near $1,500, and ETH has since bounced to retest the lower band of the descending channel around $1,750 — a level that now functions as resistance rather than support.
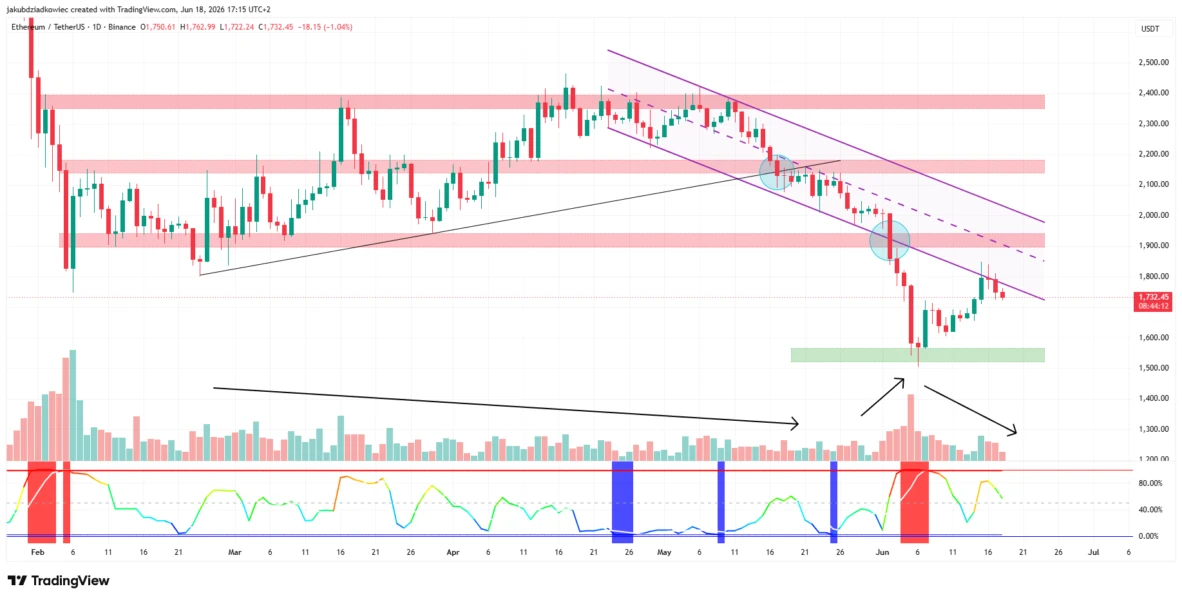
Volume and volatility metrics tell a consistent story: contraction through most of the year, a sharp spike at the channel breakdown, and renewed compression heading into June. The Bollinger Band Width Percentile shows this same compress-expand-compress pattern, reinforcing that ETH is coiling rather than trending.
A rejection at current resistance could send Ethereum back toward $1,500, roughly 13% below today’s levels. A breakdown of that floor would open lower targets and likely revive bearish sentiment across the market. Conversely, a reclaim of $1,920 would flip the technical structure in bulls’ favor, opening a path toward $2,150 — approximately 25% above current price, where prior resistance sits.
What This Means for Your CryptaBlocks Portfolio Strategy
Ethereum is coiled between a tested floor and stacked resistance, and the next volatility expansion should determine which level breaks first. Until $1,920 is reclaimed, the bearish structure retains the technical edge — but the compressed conditions mean this could resolve quickly in either direction.
For our investors, the practical approach right now centers on three principles: respect the $1,500 floor as a key risk marker, watch for a decisive reclaim of $1,920 as confirmation of trend reversal, and avoid overcommitting capital while volatility remains compressed. Compression phases like this one reward patience and disciplined position sizing far more than predictive bravado.
At CryptaBlocks, our commitment to delivering ROI to our investors means tracking exactly these kinds of structural setups — where positioning, flows, and price action align to flag an approaching inflection point. We will continue monitoring derivatives data and ETF flows closely as this setup develops.
Disclaimer: This analysis is for informational purposes only and does not constitute financial advice. All investments carry risk. Past market patterns are not a guarantee of future performance.
Stay tuned to our updates as we continue to analyze these developments and provide actionable insights for your investment strategy.
Ready to navigate market dynamics and optimize your crypto investments?